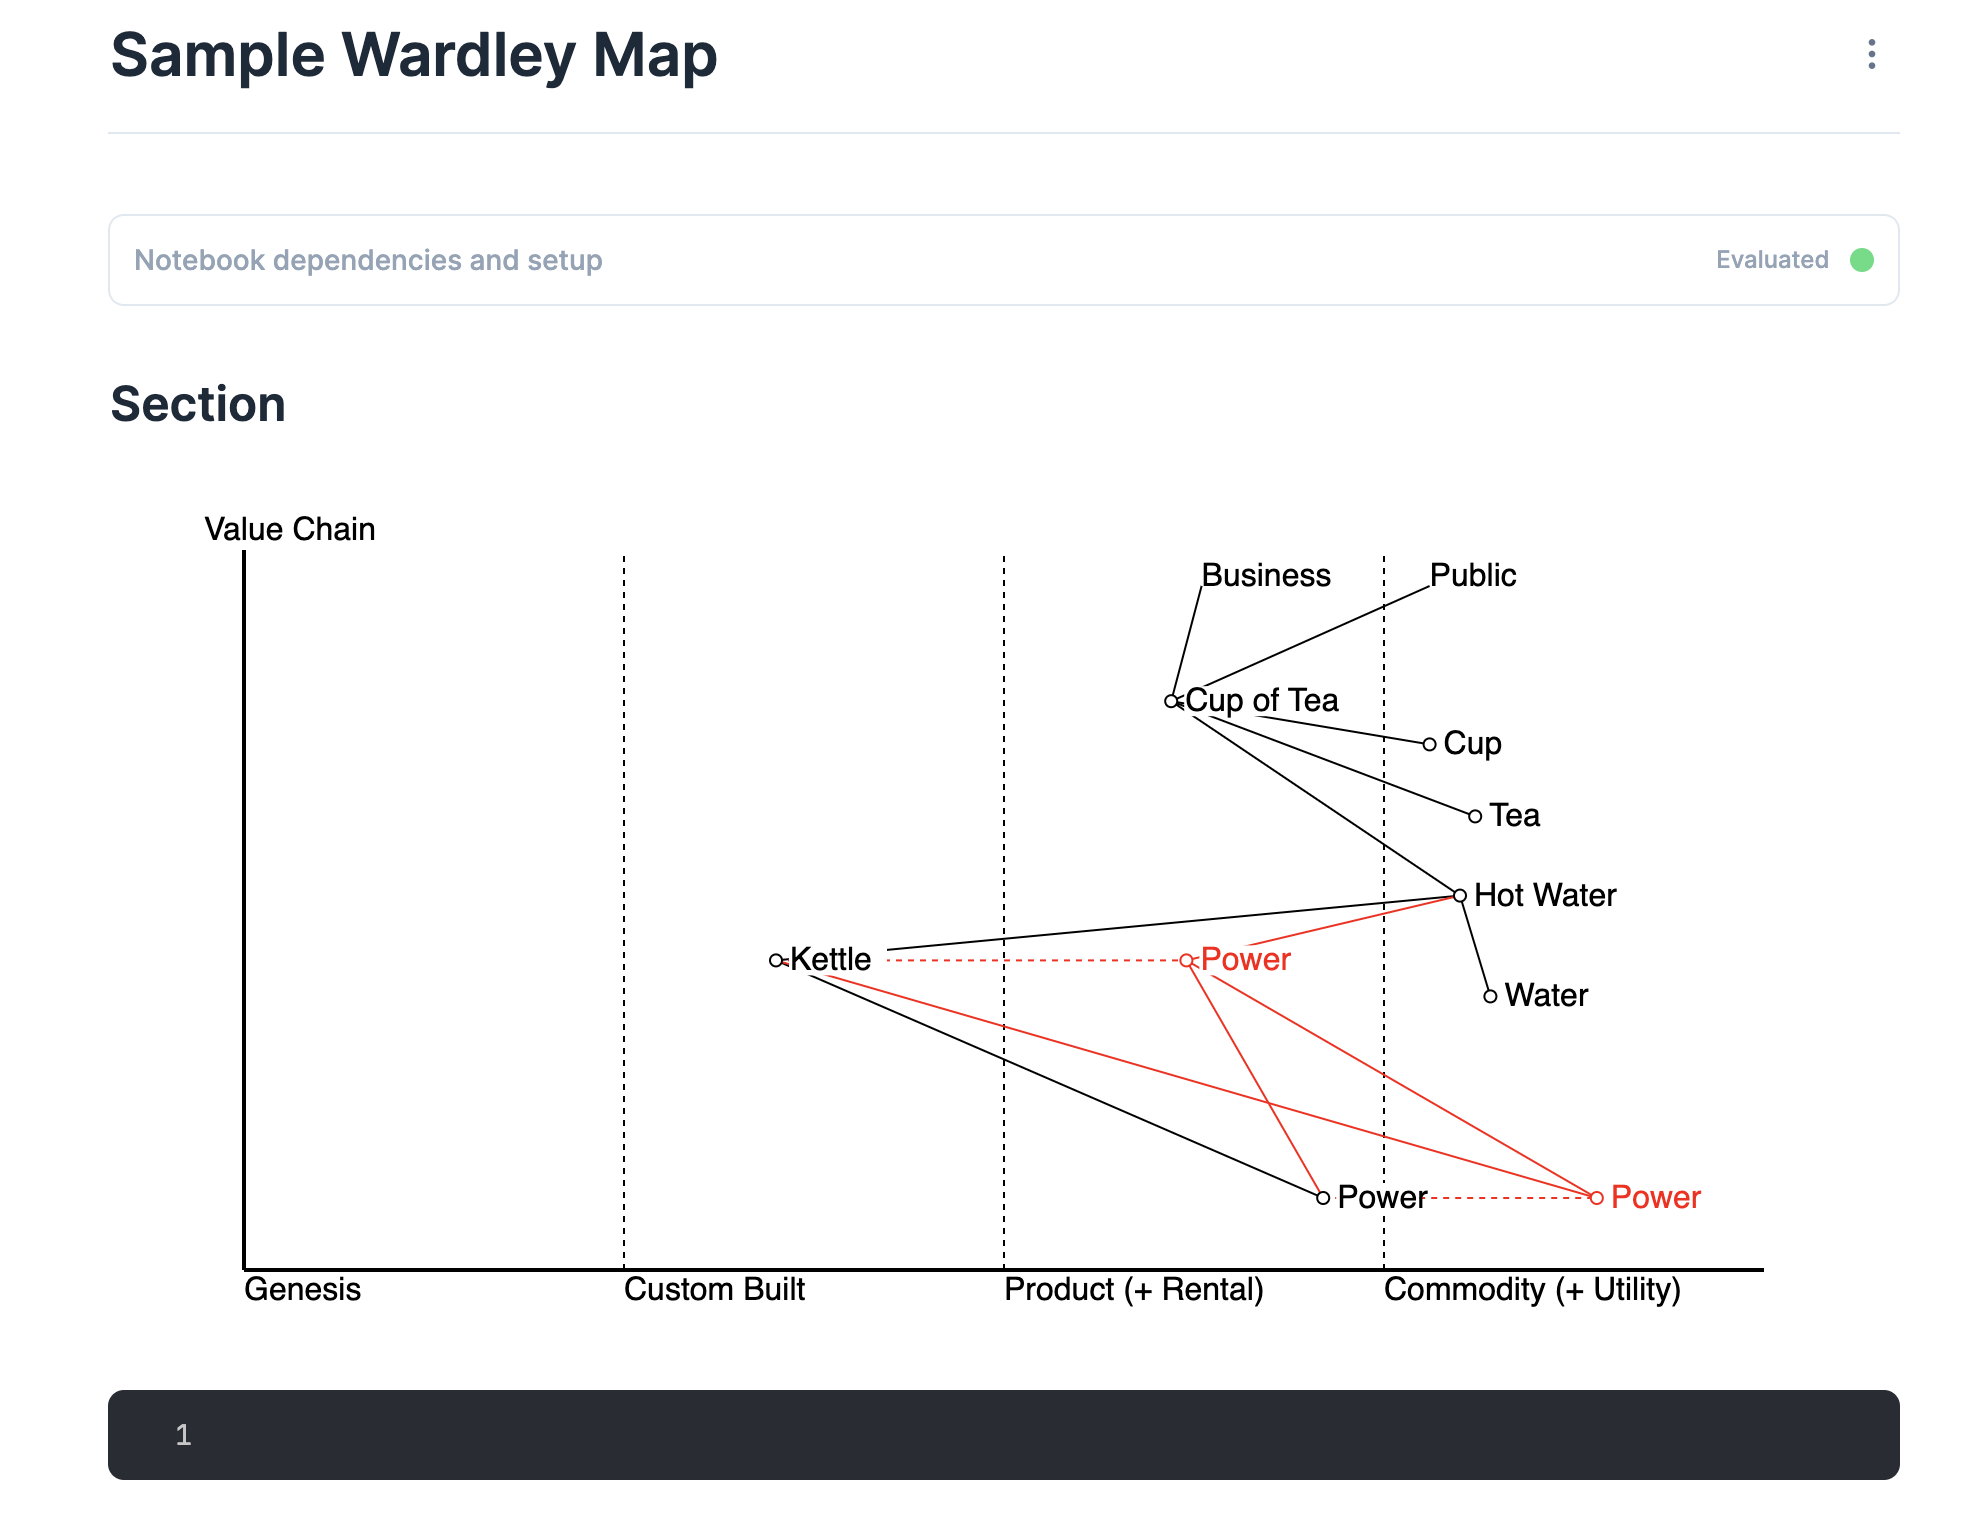
I have released version 0.5.0 of kino_wardley . This now includes notes, titles and annotations.
Sample wardley map
This comes from the following code:
KinoWardley.Output.new("""
height 800
title Tea Shop
anchor Business [0.95, 0.63]
anchor Public [0.95, 0.78]
component Cup of Tea [0.79, 0.61] label [19, -4]
component Cup [0.73, 0.78]
component Tea [0.63, 0.81]
component Hot Water [0.52, 0.80]
component Water [0.38, 0.82]
component Kettle [0.43, 0.35] label [-57, 4]
evolve Kettle 0.62 label [16, 7]
component Power [0.1, 0.7] label [-27, 20]
evolve Power 0.89 label [-12, 21]
Business->Cup of Tea
Public->Cup of Tea
Cup of Tea->Cup
Cup of Tea->Tea
Cup of Tea->Hot Water
Hot Water->Water
Hot Water->Kettle
Kettle->Power

annotation 1 [[0.43,0.49],[0.08,0.79]] Standardising power allows Kettles to evolve faster
annotation 2 [0.48, 0.85] Hot water is obvious and well known
annotations [0.60, 0.02]

note +a generic note appeared [0.23, 0.33]

style wardley
""")
Livebooks are the Elixir answer to Jupyter notebooks. They are very easy to share extend and version. Given how easy it is to install livebook as an application this makes it possible to have share buttons that open a copy of a livebook on your own machine.
Livebooks were initially developed to aid in machine learning. However given that they can contain a mix of text and executable content (machine learning models, charts fetched from websites, or now wardley maps) they can be used to share utilities, research summaries and complex information. This is in a form that is easy to version and share!
The practical use of this is that you can run a workshop and send all of the attendees a copy of the results! You can have multiple Wardley Maps mixed with whatever additional text or information that you need.
I have just released version 0.4.0 of kino_wardley.
It now has custom evolution axis labels.
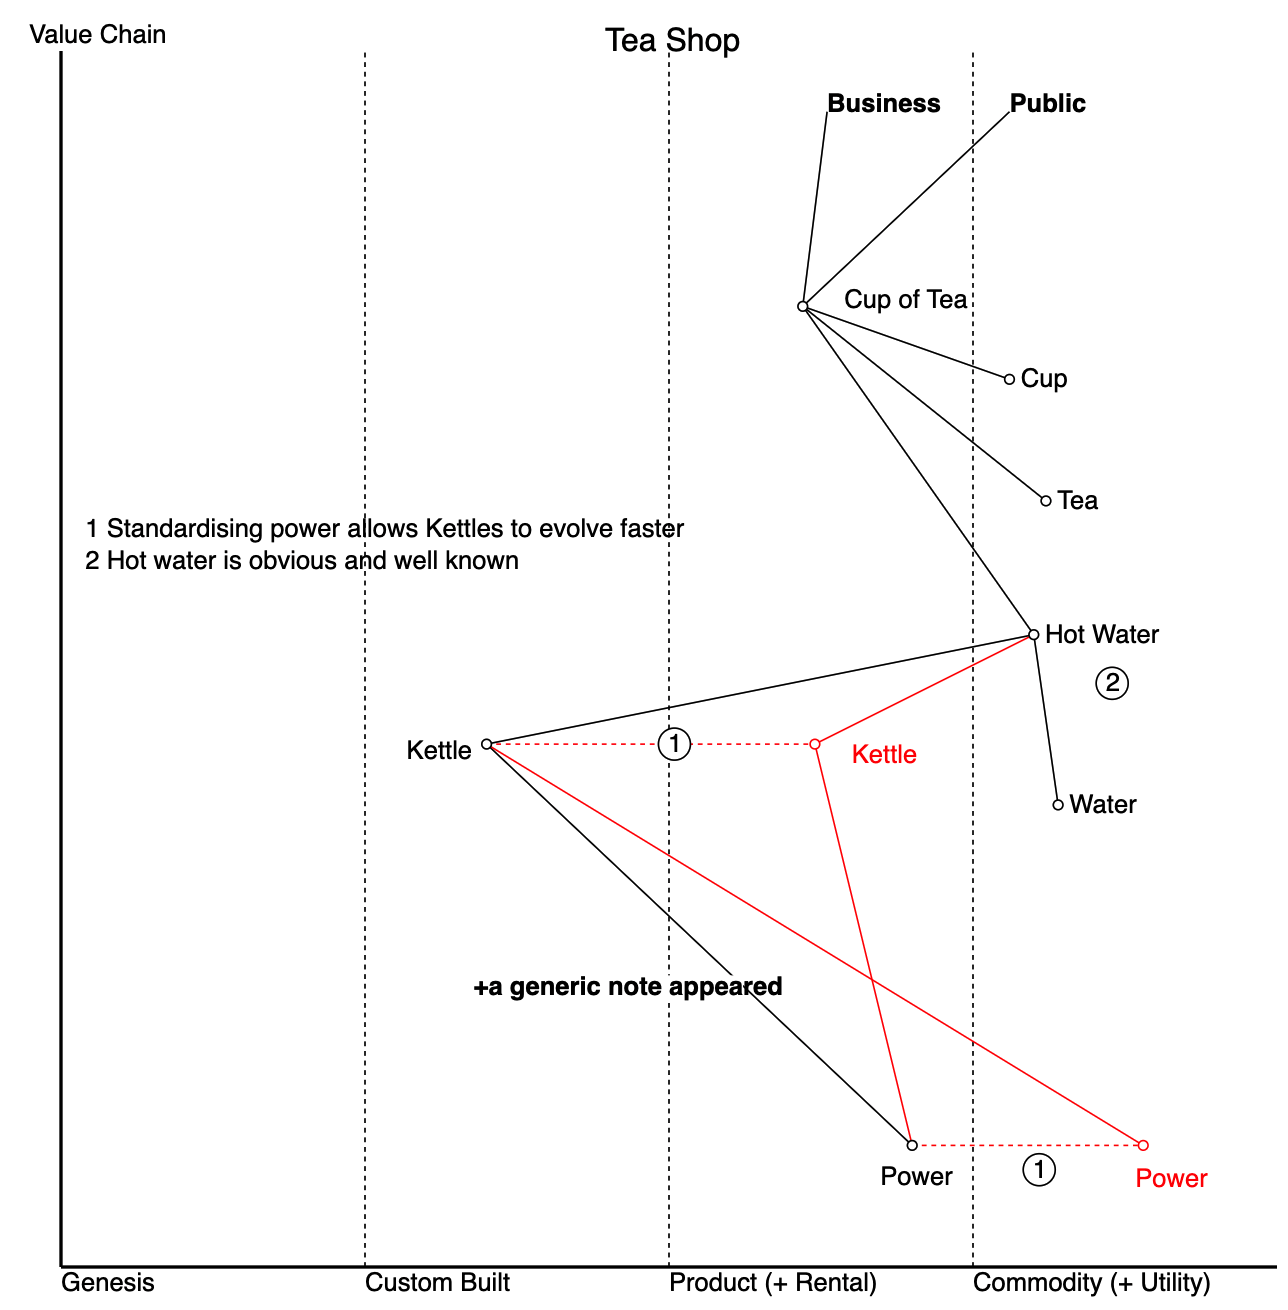
This allows the generation of Wardley Maps such as this:
Wardley Map generated with 0.4.0
Here is the code for the above:
KinoWardley.Output.new("""
id myid8
height 400
width 800
title Tea Shop
anchor Business [0.95, 0.63]
anchor Public [0.95, 0.78]
component Cup of Tea [0.79, 0.61] label [19, -4]
component Cup [0.73, 0.78]
component Tea [0.63, 0.81]
component Hot Water [0.52, 0.80]
component Water [0.38, 0.82]
component Kettle [0.43, 0.35] label [-57, 4]
evolve Kettle [0.43, 0.62] label [16, 7]
component Power [0.1, 0.7] label [-27, 20]
evolve Power [0.1, 0.89] label [-12, 21]
Business->Cup of Tea
Public->Cup of Tea
Cup of Tea->Cup
Cup of Tea->Tea
Cup of Tea->Hot Water
Hot Water->Water
Hot Water->Kettle
Kettle->Power
evolution Experiment->Prototype->Production->Product
""")
I have also found that onlinewardleymaps.com support a lot more features than this currently does. It will take a while to catch up.
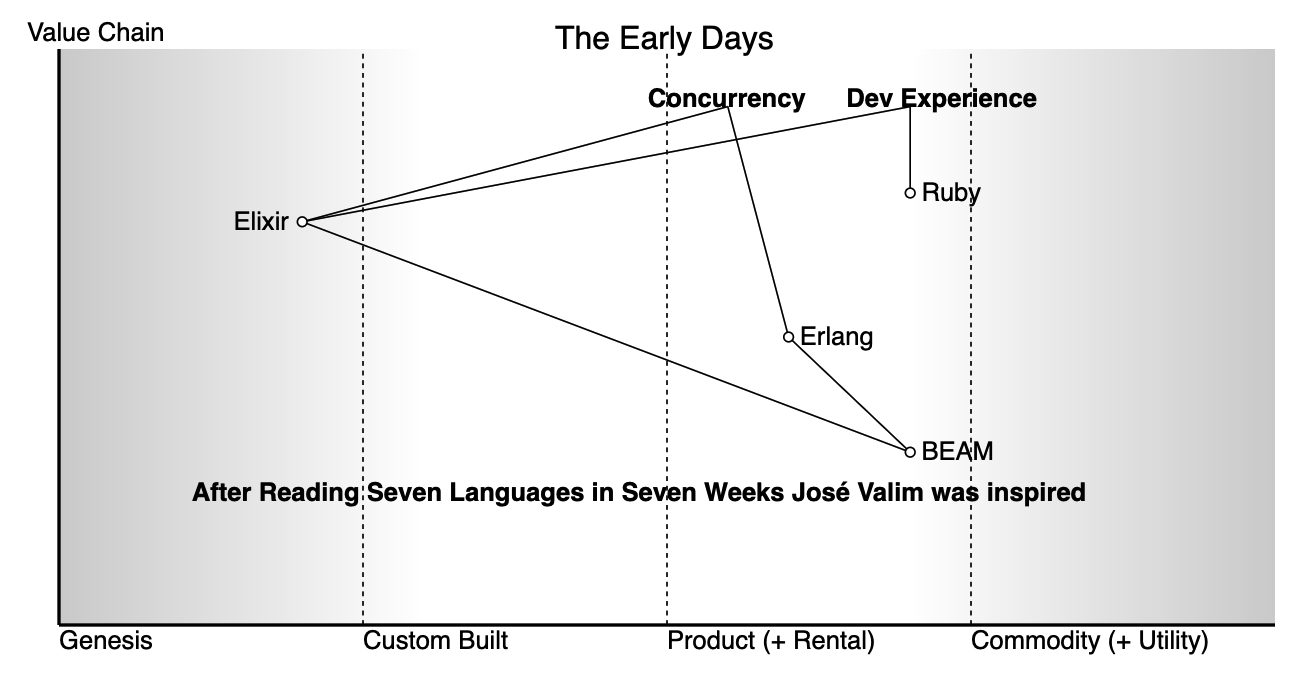
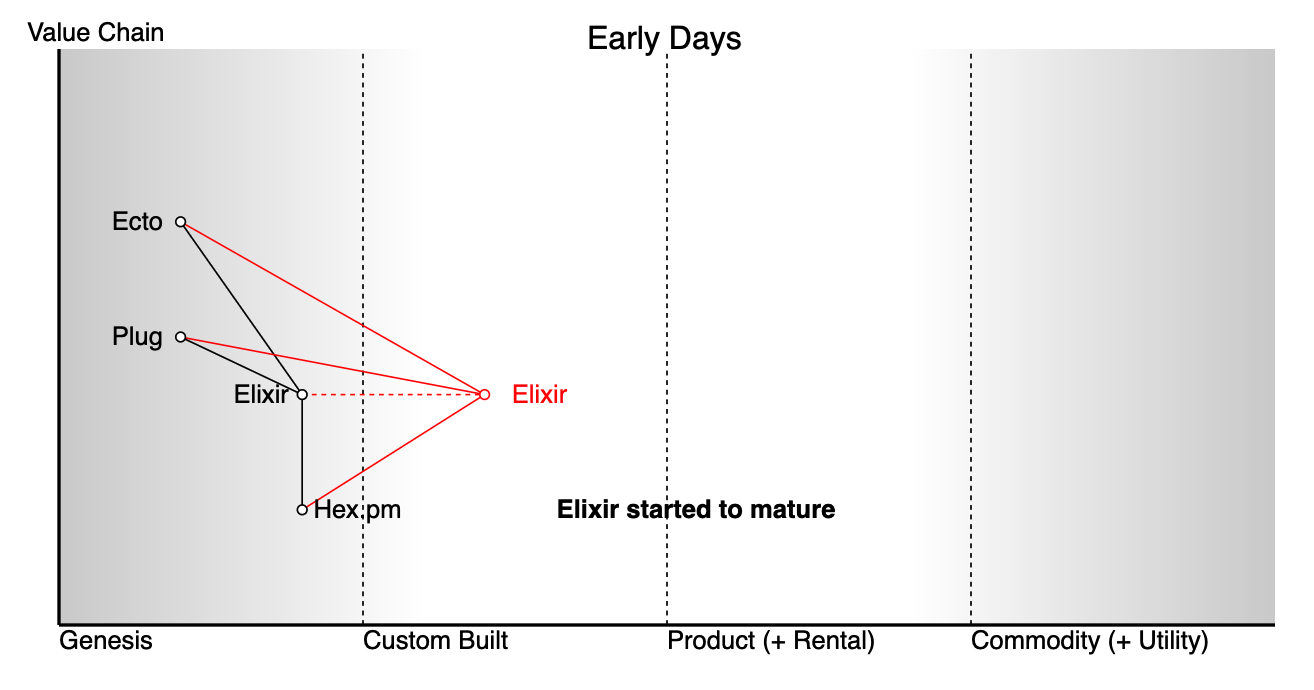
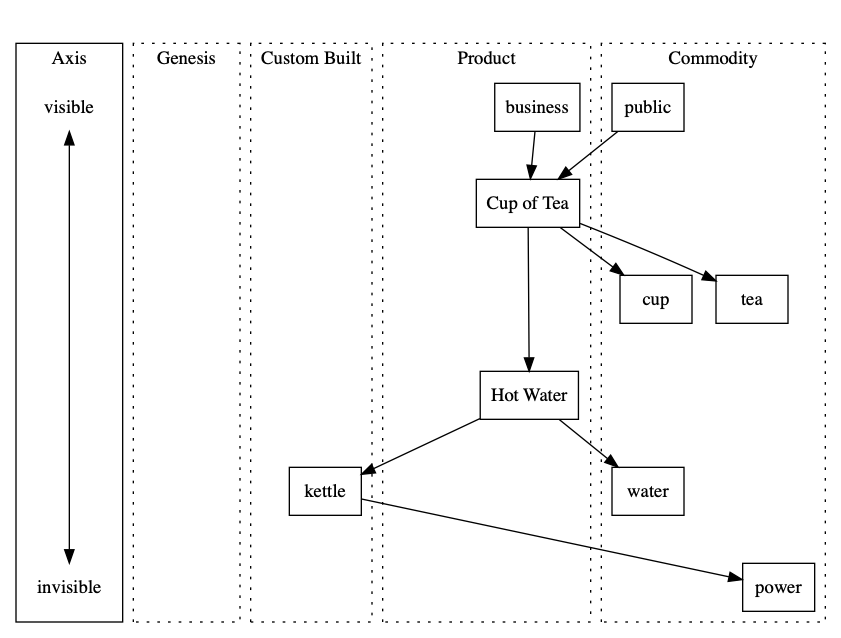
This is a more advanced example of using grapviz to build a wardley map.
This is a wardley map generated from Graphviz.
It’s not a very good map, as it’s not trying to solve a real problem. This is mostly to see if I can use graphviz to display this.
The next example is more realistic.
Cup of tea wardley map
This is one of Simon Wardley’s simple examples where a tea shop has built a custom kettle. It’s a great example of demonstrating that you are possibly doing something wrong in an obvious manner.