This is a more advanced example of using grapviz to build a wardley map.
This is a wardley map generated from Graphviz.
It’s not a very good map, as it’s not trying to solve a real problem. This is mostly to see if I can use graphviz to display this.
The next example is more realistic.
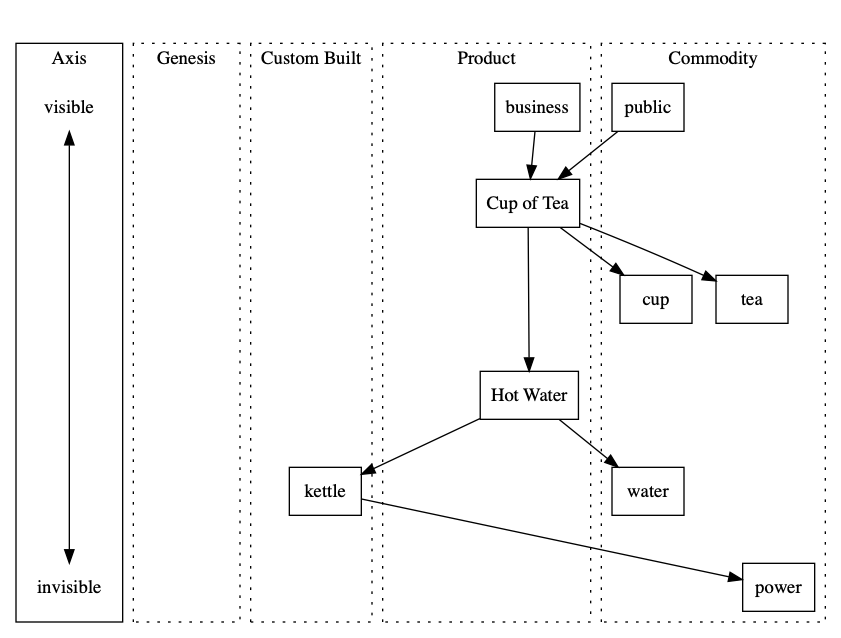
Cup of tea wardley map
This is one of Simon Wardley’s simple examples where a tea shop has built a custom kettle. It’s a great example of demonstrating that you are possibly doing something wrong in an obvious manner.
This file contains hidden or bidirectional Unicode text that may be interpreted or compiled differently than what appears below. To review, open the file in an editor that reveals hidden Unicode characters.
Learn more about bidirectional Unicode characters
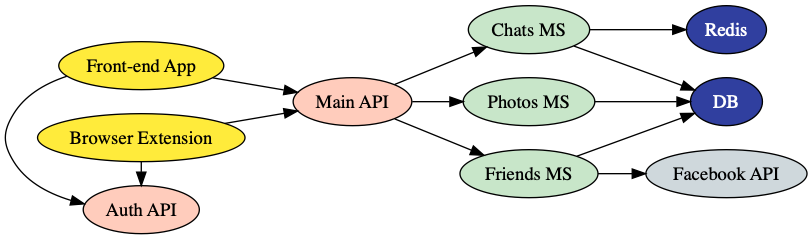
This is all you need to generate the below image from the above text:
dot architecture.dot -Tpng > architecture.png
You can even add annotations to the lines by adding [label=”My Link”] to the connection before.
These are ideal to add to the README.md of github projects.
I especially like the idea of having a diagram with the source to create it under source control.
This requires you to install graphviz which can be done:
# Mac
brew install graphviz

# Windows
choco install graphviz

# Linux
sudo apt-get install graphviz

For the purists who want to keep their machines clean:

# Docker
cat file.dot | docker container run --rm -i vladgolubev/dot2png > file.png