My team develops and supports the systems that we work on. It is important to know what is normal so that it’s easy to see production problems before they get too serious.
One of the systems that I work on monitors a data source and sends emails out to our subscribers. I am being vague here so as to not breach client confidentiality. This system is a graph of 12 (mostly) micro-services. To know that this is healthy is a big undertaking. This is how we do this.
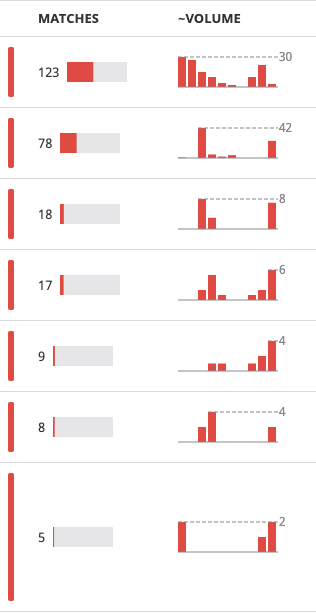
We have used our logging tool (DataDog) to capture the signals that we receive and the messages that we send. These are charted here on a one week scale:

The left is what we have detected and the right is what we send. The users are interested in different signals so the spikes will be of different shapes. We can see problems anywhere in the network using these two charts. The one on the right should be similar to the one on the left.
Gaps on the left will always be matched by gaps on the right. This allows us at a glance to see what is missing or abnormal. Extra gaps on the left are caused by breaks in the input feeds (which we will then check) gaps in the right are problems in processing the data.
We also keep an eye on the errors logged in the past 24 hours. The most frequent error normally requires investigation. Datadog provides a Patterns tool that helps here:
I typically try to fix the most frequent error each day. Here one of the feeds had been broken by a change on the other end.
Given the level of logging that we use I can’t remember the last time that I needed a debugger. Unit tests and logs solve this far quicker.

One thought on “What Is Normal Anyway?”