I have released version 0.5.0 of kino_wardley . This now includes notes, titles and annotations.
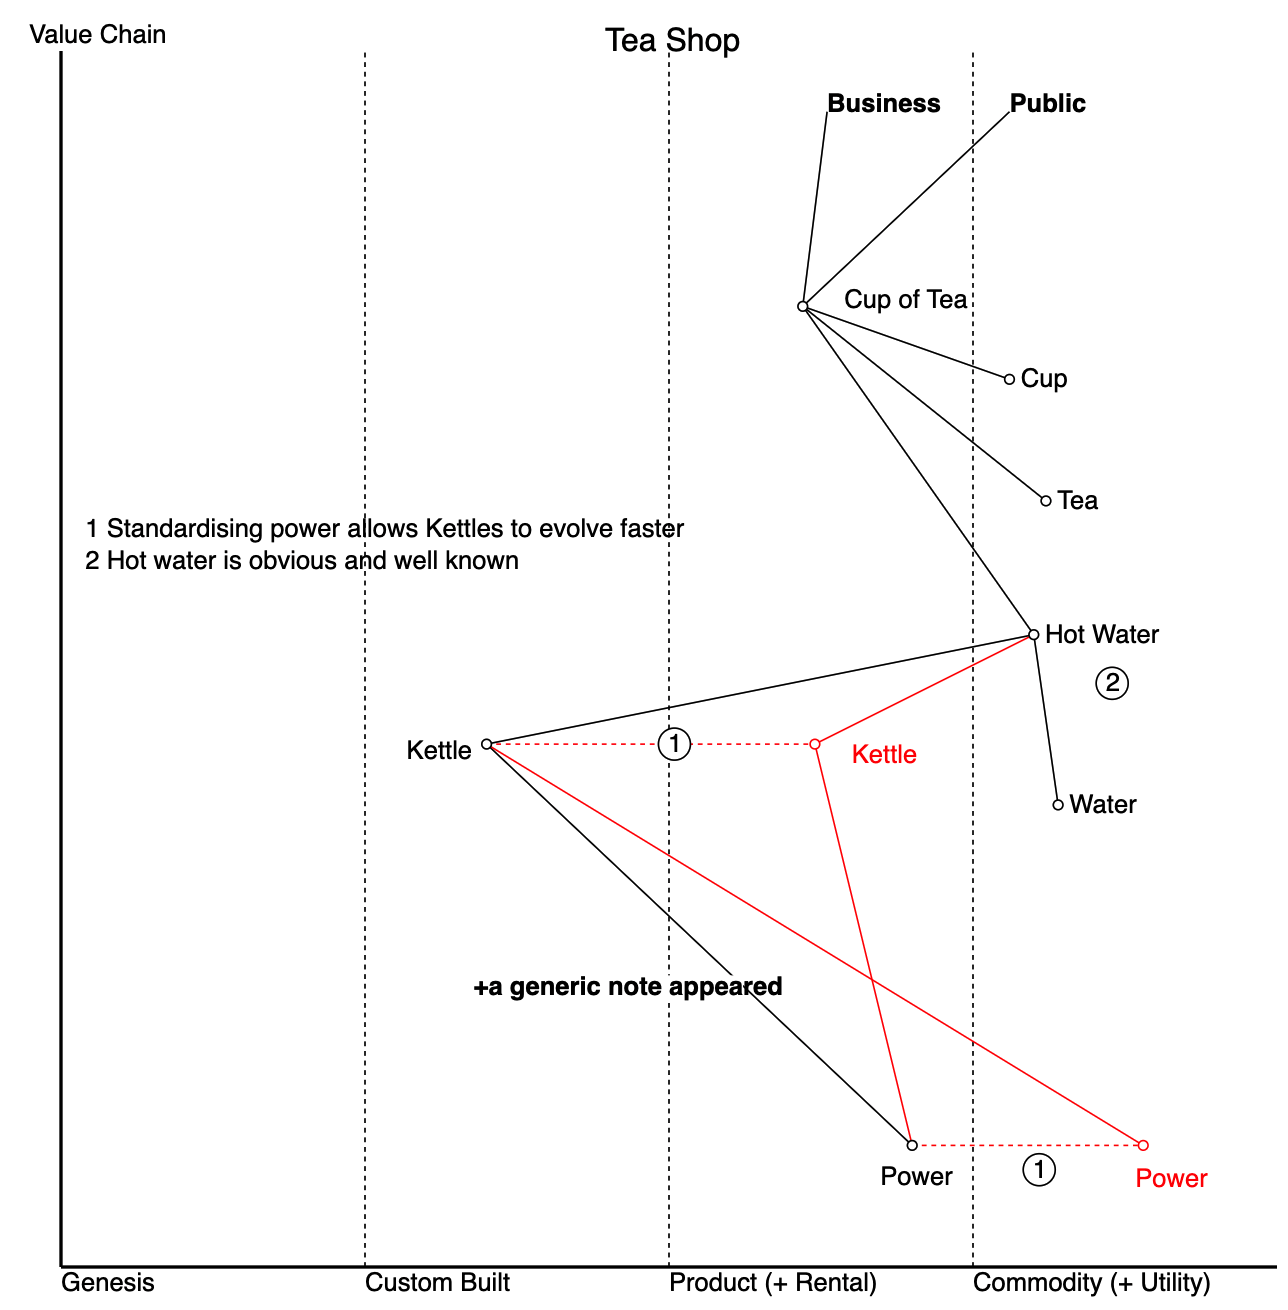
Sample wardley map
This comes from the following code:
KinoWardley.Output.new("""
height 800
title Tea Shop
anchor Business [0.95, 0.63]
anchor Public [0.95, 0.78]
component Cup of Tea [0.79, 0.61] label [19, -4]
component Cup [0.73, 0.78]
component Tea [0.63, 0.81]
component Hot Water [0.52, 0.80]
component Water [0.38, 0.82]
component Kettle [0.43, 0.35] label [-57, 4]
evolve Kettle 0.62 label [16, 7]
component Power [0.1, 0.7] label [-27, 20]
evolve Power 0.89 label [-12, 21]
Business->Cup of Tea
Public->Cup of Tea
Cup of Tea->Cup
Cup of Tea->Tea
Cup of Tea->Hot Water
Hot Water->Water
Hot Water->Kettle
Kettle->Power

annotation 1 [[0.43,0.49],[0.08,0.79]] Standardising power allows Kettles to evolve faster
annotation 2 [0.48, 0.85] Hot water is obvious and well known
annotations [0.60, 0.02]

note +a generic note appeared [0.23, 0.33]

style wardley
""")
In production you would typically have a sidecar application to capture and rebroadcast the messages.
In OpenTelemetry terms a Span is a time interval during which a given process ran. These can be nested. The result is that an Observability tool could capture the spans and construct a visualisation of what was happening. Spans are more useful than raw log data as it has a controlled meaning which would need to be inferred.
span_eater currently just logs that it has received the message. I am planning to make it more sophisticated, and then build a LiveBook to host it in. Currently it is useful to remove the log messages that otherwise get generated: `